Comparing GTFS Schedules and SIRI Real-Time data
PI: Eran Ben-Elia
![]()
Researcher: Dror Bogin
Funding: Survey Of Israel 2018-2019
Public transportation reliability can be a deciding factor in users preferred mode of travel and in their choice of operators.
The issue of reliability has been addressed as a repeating problem for decades now However,
most of this time data collection was done by human attendance and observation, i.e. either by a researcher riding the bus,
tram or train or observing at a designated stop.
TWith the advances in Information and Communication Technologies (ICT),
reliability measurements based on the Global Positioning System (GPS) data have evolved and have been used also in research.
the amount of PT demand related studies has been steadily increasing over the last decade,
with data generated from smartcard transactions providing a growing source of data for research.
Studying the supply side of PT grants us insight into the actual service level operators are providing,
as opposed to the perceived service level which might be received from questionnaires,
or non accurate data which might be received from smartcards which only record tap-ins.
In this research project we integrate and compare two BIG DATA sources:
- SIRI or Service Interface for Real Time Information which is an XML protocol that enables the supply of real-time PT data;
- GTFS or General Transit Feed Specification which is the current global standard in PT schedule publication
Using these two data sources a working model was built which allows us to compare the SIRI data which is collected in real time,
with the daily schedule published by the PT authority, in Israel’s case by the Ministry of Transport and Road Safety.
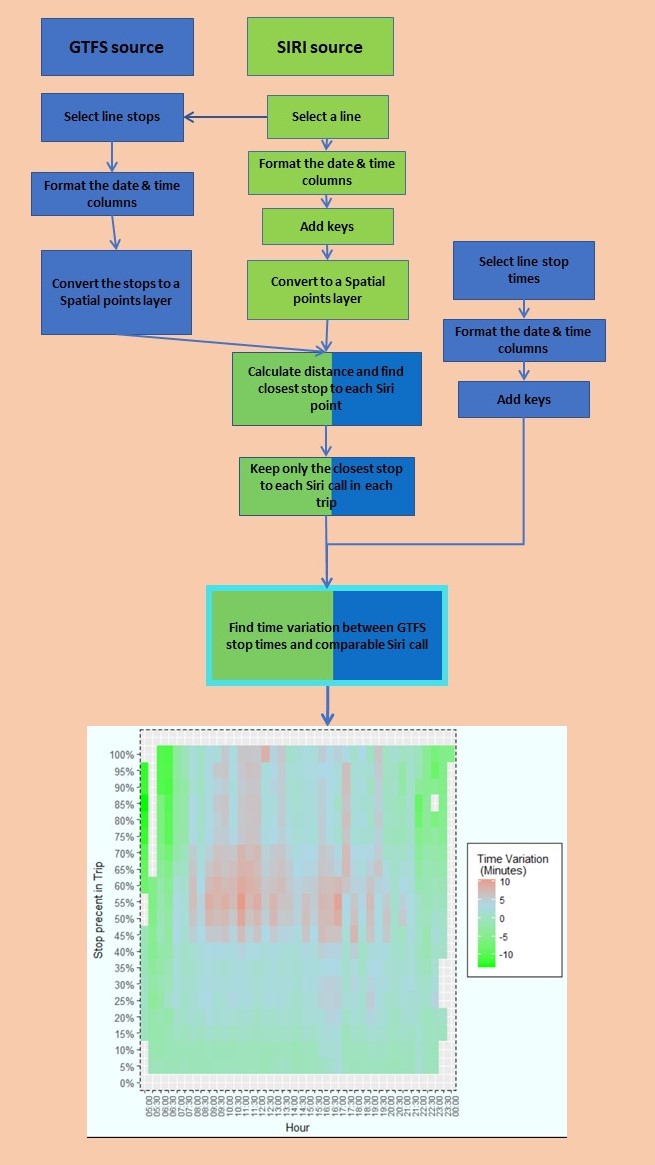
Illustration of the model
After the first Proof of Concept which we performed on a week of collected data in July 2017 of the cities Be’er Sheva and Tel Aviv,
The research was funded by the Survey of Israel(Mapi).
The funding will be used to develop a graphical user interface in order to make the model and the data more accessible.
The results gained from the use of the model will be a turning point in establishing novel methods for level of service evaluation,
will contribute to improving the PT planning process and necessary reforms in metropolitan areas and will eventually allow increasing PT usage in the long run.
Hourly mean time variation for Be’er Sheva (top)
and Tel Aviv (bottom).
Data on a half hour basis, between the dates of July 17th and July 23rd 2017.
Blue representing station where the mean time difference is relatively small (around no time difference) with red being late and green being early.